


How to Make an Executive Marketing Report for Your CEO (Or Board)
November 17, 2021
Your monthly marketing presentation is coming up, and it's time to show your leadership the major impacts marketing has been making.
What are the metrics you should be tracking?
What does your CEO or board care to see from the marketing department each month?
How can you demonstrate that your digital marketing program is bringing in the leads and sales each month?
To answer these questions, here is your step-by-step guide through the process of putting together a highly informative monthly marketing report using a few different tools.
Prepare to impress your CEO and maybe get a raise.
1. Track the Metrics that Matter
You need to ensure you are currently tracking the metrics your executive leadership cares about. We also love how a subject line emoji can dramatically increase open rates; your executive leadership will want to hear about five metrics.
- Marketing Sourced Revenue- Your executive leadership will want to understand how marketing contributes to your revenue. So, you will want to have reports that indicate how you and the marketing team are directly impacting the bottom line. By showing the revenue that can be sourced back to marketing efforts, you have a tangible way of indicating the revenue your team has helped generate.
- Average Lifetime Value of Marketing Sourced Customers- Many marketing teams have the strategy of land and expand. The focus is less on selling the highest tier product to the right fit customers, and the focus is more on closing the right-fit customers. As a result, you want to show over the customer's lifetime with your organization how much revenue they have overall contributed.
- Sales Qualified Leads/Marketing Qualified Leads- The goal of reporting this metric is to indicate that your marketing efforts are engaging the right-fit potential customers. Organizations define their MQL & SQL terms differently.
For the purposes of this blog, an MQL is defined as an Ideal Client Profile Fit business that has entered into your CRM or been actively engaging with your business and has started becoming a part of your regular marketing cadence. An SQL is an Ideal Client Profile Fit business that has indicated they would like to talk with sales. Ideally, marketing would report on SQL's or marketing-generated SQL's, but many executive leaders still want to track that MQL's are being generated.
Should your leadership still require MQL reporting, include the metric. Otherwise, focus on SQL's generated sourced from marketing. - Customer Acquisition Cost- Your executive leadership wants to understand how much money they need to put into marketing to get the intended result. When you understand your customer acquisition cost, you can help your leadership understand what financial investment will be required to hit currently projected goals.
- Return on investment- Every executive leader wants to understand the ROI. You likely already knew that your leadership would want to understand what they are getting for the money they are investing.
Ideally, you would have these metrics broken out by their specific channel (organic, paid, organic social, email, etc.) to accurately demonstrate the impact each channel has on the overall performance of your marketing mix.
If you are leveraging HubSpot, you can build a report filtering deals that were won and include filters on lead sources. Once you have identified what will count towards marketing sourced leads, you can ensure your entire organization understands how to properly indicate lead sources. To keep lead sources simple, if the lead comes from anywhere outside of a partner directory, sales outreach, or an email referral, the lead will likely qualify as marketing sourced.
Again, if you're leveraging HubSpot, you can run reports that will show you the number of MQL's and SQL's created in a given month. Simply create a report based on contact lifecycle stage. Then you can filter based on date ranges to see how many contacts were in each life cycle stage.
When looking at your customer acquisition cost, if you don't have a more robust attribution system or implement more difficult-to-track marketing tactics, take your entire marketing spend and divide it by the number of customers you acquired. Should you have abilities to report on specific channels, your executive team may want to understand how each channel contributes overall to the marketing mix.
Provide a high-level overview of the strategy with a short explanation of how each channel contributes. Organic social should not have the same measurement of success as highly specific keywords in organic search. As long as you deliver an acceptable customer acquisition cost, your executive team will likely not scrutinize each channel.
When looking at your ROI, take the amount of marketing sourced revenue and divide it by your marketing spend. This will give you an easily measured ROI of your marketing efforts.
Now that you are measuring all of the metrics that matter, it's time to create your presentation.
2. Design a Presentation Template
As you start building out your presentation, you'll want something easy to share, like Google Slides. The goal of developing a template is to help streamline your presentation creation and ensure that you aren't missing any information you know your executives want to see. Additionally, creating a well-designed presentation gives your report some professional flair.
It can be as simple as your organization's logo in the footer and a matching color scheme for the heading text. Keep it clean, with a white background and nothing too distracting. In your report cover, include the date and agenda items and who will be presenting the report.
Remember, you may not need every item laid out below. This is just how Mojo Media Labs does it, and you can use our formula as a starting point.
3. The Agenda
The Agenda lists the main points you'll cover each month in your report. They may change slightly month to month, but you should have at least 3-4 basic agenda items that stay the same from month to month.
You can simply include this in the presentation, or if you are meeting in person, you can create an agenda template that can be printed for the meeting.
Recommended agenda items are typically the following:
- Monthly progress review
- Monthly performance report
- Discussion items
- Q&A
4. Monthly Progress Review
The progress review section of the report is typically a list of all completed tasks or projects for the month. The progress review also includes upcoming projects and "To-do" items.
In your case, you might include your upcoming projects and any items you need from your CEO or board before you can complete a project. Go through each item in detail to show what you've completed for the month and your goals for the next month. This section includes:
- Monthly projects and tasks completed
- Upcoming projects, campaigns
- To-do's for your CEO or board members
5. Performance Report
Now that you've shown your CEO all the projects you've been working on this month, it's time to show the results. This is where you can prove the value of your marketing.
The key to this section is data visualization. Your executive team likely doesn't want to dig into the details. They need a high-level overview of "what direction are we moving and why." They simply want to know, "Are we executing our marketing plan, and are we hitting marketing goals."
Again, if you are leveraging HubSpot, check out the first step to developing your reports and getting the appropriate data in the charts.
In addition to the metrics outlined in the first section, executive teams want to see a few other common metrics. Your performance report might vary depending on what your CEO wants to see, but these are some of the most important metrics to follow to see how your Marketing is working.
- Marketing Sourced Revenue: Monthly, Quarterly, and Year Trend
- Average Lifetime Value of Marketing Sourced Customers: All Time
- MQL/SQL: Monthly Trend
- Customer Acquisition Cost: All Time
- ROI: Yearly
- Sessions: Monthly trend
- Leads: Monthly trend
- Customers: Monthly trend
Here are a few snapshots from the Mojo Media Labs CRM to show you what your reports can look like.
This report shows what traffic from our website converted into contacts, and how many of those contacts converted into customers. This report helps show executive teams the importance of driving traffic but can also provide strategic insight for continuous improvement. For example, the chart above shows that this website can generate quite a bit of traffic, but could probably improve contact conversions, or needs to start getting more qualified traffic.
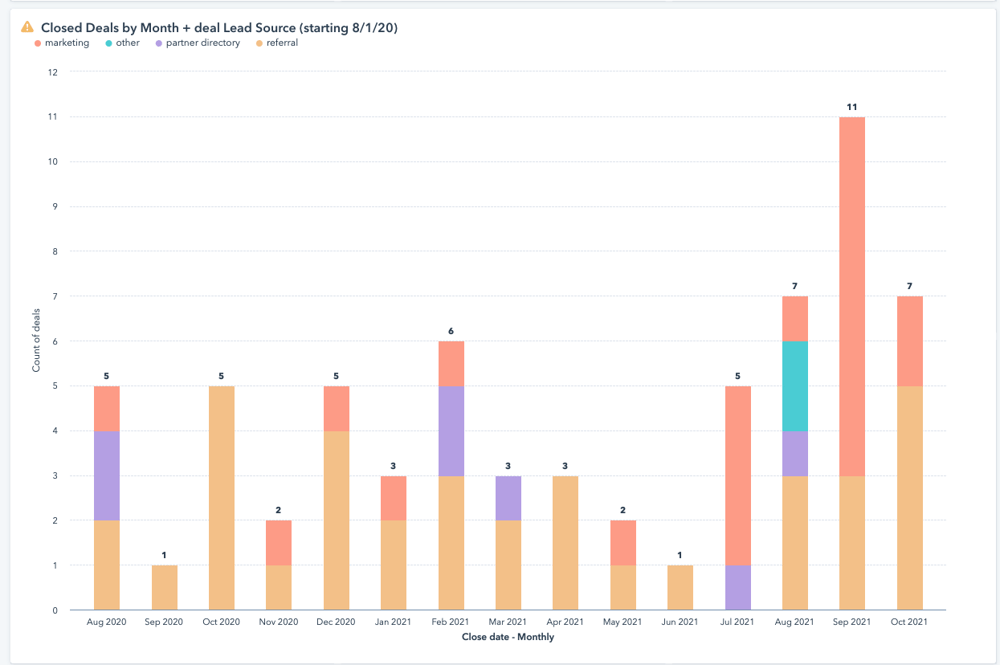
This chart shows monthly closed deals and their lead source over the past year and a quarter. Based on this chart, you can see that marketing has started to take a much larger role in generating revenue. When you dig a bit deeper, you can also see that referral and partner sourced revenue closes faster based on trust. This informs the marketing strategy to focus more on building marketing assets that will prove authority and build trust within the market.
This last chart helps executives see the number of contacts flowing into the CRM. The insight gleaned from this chart is that the website generates numerous contacts. The question then becomes converting those contacts into customers. If you converted 1% of the subscribers into customers, there would be 40 new deals closed.
When presenting this data to your executive team, look at three main big picture points:
Visits -----> Qualified Leads -----> Customers
The bottom line is always, "did we get new customers?" More traffic means more leads, and more leads turn into more customers. Period. Follow that line, and you'll show your CEO that your marketing program effectively brings in new business.
Getting Started Today
The most important piece of this report is the ability to track and show the data you've been collecting. If you aren't operating on a CRM or marketing automation system that allows you to show the impacts your marketing makes on the bottom line, you need better tracking.
You have a few options to consider, but HubSpot has become the go-to option for implementing highly effective marketing that shows bottom-line impacts for many marketers. If you can't show the impact you are making, it will become increasingly difficult to get executive buy-in and grow the business.
If you are interested in learning more about HubSpot functionality, check out Why HubSpot is the Best CRM Platform for Scaling Companies.

Share
Subscribe

